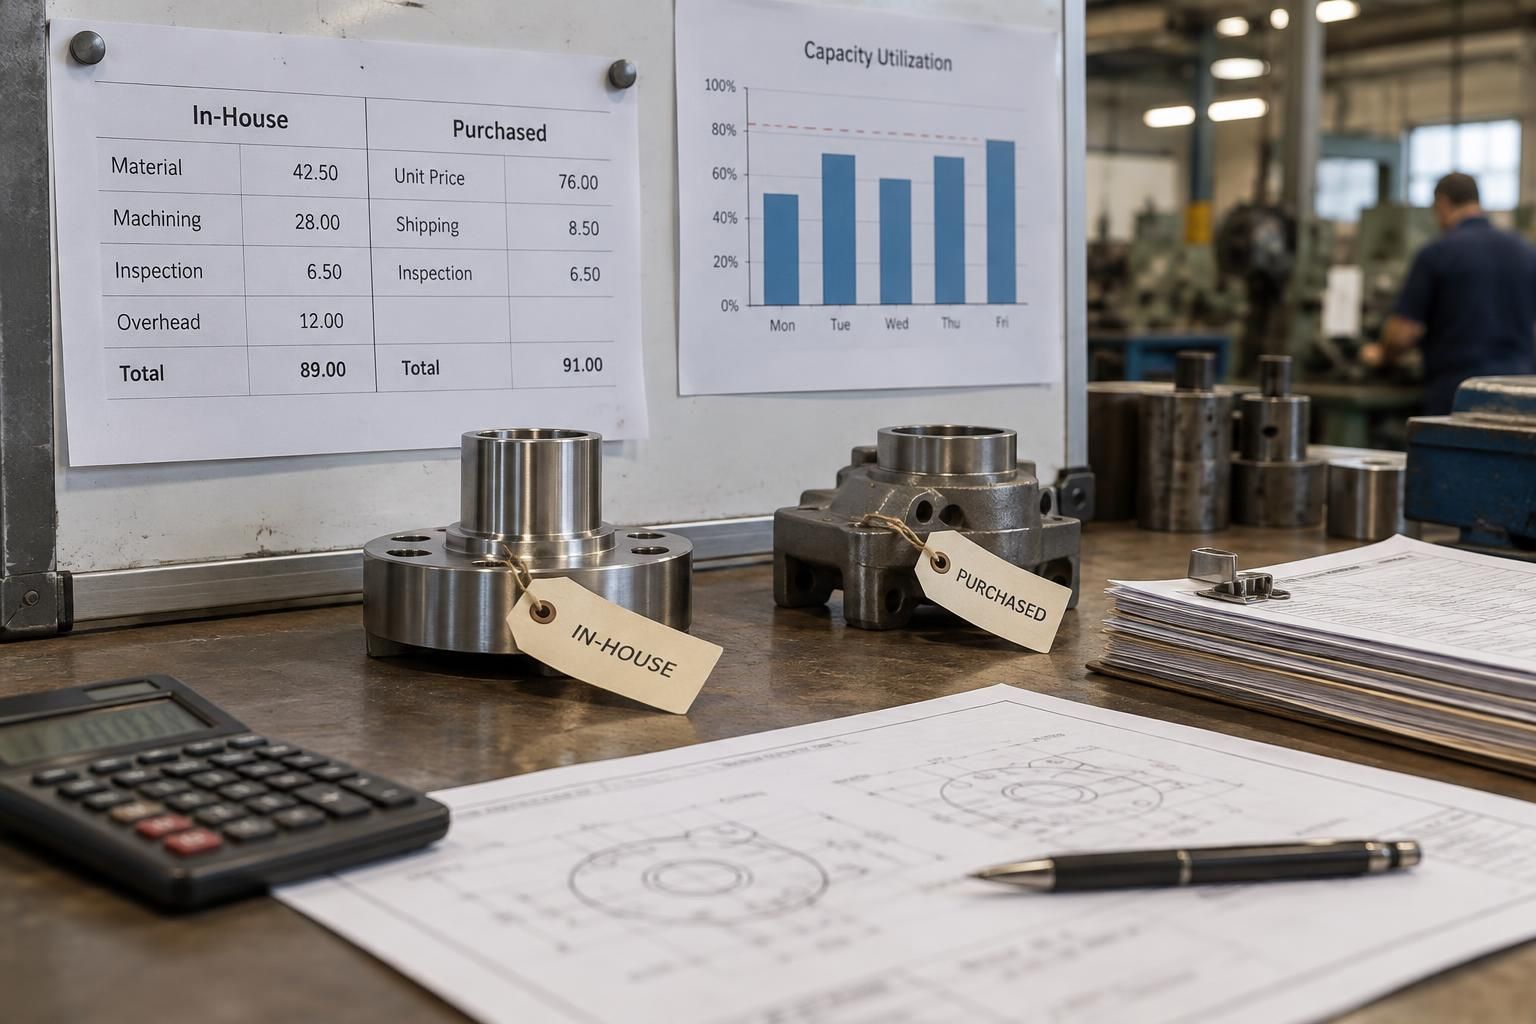
Cost Driver AnalysisSystematically Understanding Cost Causes in Procurement
Procurement glossary · Updated · 7 min read
Also known as: Cost Driver Analysis, Kostentreiberanalyse, Cost Driver Identification, Kostenursachenanalyse
Short answer
- A cost driver analysis systematically identifies the causes that generate costs in procurement, production and logistics.
- Typical drivers are material content, specifications, batch sizes, logistics costs and quality costs.
- The result is data-driven levers for negotiations, design changes and process optimisations in procurement.
Cost driver analysis is a systematic method for identifying and evaluating the factors that cause costs in procurement, production and logistics. For buyers and supply chain managers, it is the central instrument for conducting price negotiations on a data-driven basis and finding levers for sustainable savings. It combines data from spend analytics, materials management and procurement controlling into a reliable cost picture. In practice, the focus typically lies on material, process and logistics costs as well as on behaviour-dependent drivers such as batch sizes or specification changes.
Key facts
- Cost driver analysis identifies the causes behind costs, not just their magnitude.
- Typical cost drivers in procurement are material content, batch sizes, logistics processes, specifications and supplier structure.
- Methods such as ABC/XYZ analysis, total cost of ownership and should-costing complement one another.
- It forms the basis for supplier negotiations, make-or-buy decisions and the procurement strategy.
- Data quality in the material master and in spend analytics largely determines the validity of the findings.
- Results typically feed into procurement controlling and annual price review processes.
Contents
- Definition: cost driver analysis
- Methods and approach of a cost driver analysis
- Typical cost drivers in industrial procurement
- Key KPIs of cost driver analysis
- Risks and controls in cost driver analysis
- Current developments and digitalisation
- Typical metrics
- Practical example
- Conclusion
- Frequently asked questions
Definition: cost driver analysis
Cost driver analysis is the systematic examination of the factors that cause or increase costs. It goes beyond a mere cost centre or price analysis by making cause-and-effect relationships visible. The aim is to derive measures that reduce costs permanently rather than merely shifting them.
Distinction from pure price analysis
A price analysis compares prices with market data, benchmarks or historical values. Cost driver analysis, by contrast, asks why a part or service has this cost structure at all – for example due to material selection, tolerances, batch sizes or logistics effort. Only this level of causes enables genuine negotiating power and design or process changes. In practice, it is therefore often combined with should-cost models and total cost of ownership considerations.
Position within the procurement process
The analysis belongs to strategic procurement controlling and provides input for the procurement policy, the procurement manual and the supplier strategy. It is typically carried out annually or per project for relevant commodity groups. An updated analysis is sensible in the event of price changes, supplier changes or new products. The results should be documented so that negotiation targets and cost reduction levers remain traceable.
Methods and approach of a cost driver analysis
A step-by-step approach has proven its worth: establish the data foundation, identify cost priorities, question the drivers and derive measures. It is important that the result does not end in a spreadsheet evaluation but leads into concrete negotiation and optimisation measures.
ABC and XYZ analysis as a starting point
ABC analysis identifies the items and suppliers that account for the majority of procurement volume; in practice, a small number of line items frequently account for most of the spend. XYZ analysis supplements this by examining consumption patterns and plannability. The combination shows where a detailed cost driver analysis promises the greatest leverage: A items with stable demand merit a should-cost consideration, sharp A items rather supply chain and risk measures.
Should-costing and price breakdown
In should-costing, a target cost model is built from material, manufacturing, logistics and overhead cost components. A price schedule or a structured price breakdown provides the raw data for this. Comparing target and actual costs reveals negotiating scope and unrealistic cost targets. Industry benchmarks and market prices are typically used for labour shares, material surcharges and energy components.
Considering total cost of ownership
Costs do not arise only in the unit price: transport, customs, inspection effort, scrap, inventory and failure risks are also part of the analysis. A TCO view uncovers drivers that remain invisible in the unit price – for example high transport costs for onshoring alternatives or quality costs with low-price sources. Especially for complex parts with customs and preference issues such as the EUR.1 preference certificate, logistical and administrative drivers can carry considerable weight.
Typical cost drivers in industrial procurement
As experience shows, most drivers can be traced back to a few categories: material, specification, quantity and rhythm, logistics and quality. Anyone systematically reviewing these categories will find the biggest levers quickly.
Material and specification
Material usage is the dominant driver in many industrial commodity groups – material costs frequently make up the largest share of the unit price. Material selection, tolerances, surfaces and safety surcharges act directly here. Coordination with engineering, for example within co-development, can simplify specifications in line with the market. Superfluous documentation and inspection requirements are also hidden cost drivers that can be addressed via the inspection plan.
Batch sizes, inventories and logistics
Order quantities and repetition rhythm influence price and costs simultaneously: small batches increase set-up and transport costs, while batches that are too large tie up capital and storage space. The economic order quantity (EOQ) helps to derive optimal order quantities; inventory metrics such as inventory turnover and coverage show the effect over time. Lead times and Incoterms determine transport and capital commitment costs. Anyone addressing these points often reduces costs without touching the supplier price.
Process and quality costs
Scrap, rework, returns and duplicate inspections are cost drivers that are often hidden in internal accounting. A structured supplier evaluation makes them visible and creates a basis for A-supplier decisions. The process costs of procurement itself – effort for enquiries, orders and complaints – are also among the drivers and can be reduced through electronic tendering and automated processes.
Key KPIs of cost driver analysis
Without metrics, the analysis remains theoretical. A compact set of KPIs that is reported regularly in procurement controlling and shows the effect of measures over time is sensible.
Cost and price metrics
Key metrics are the material cost ratio, price variance versus the previous period, savings achieved against target values and the share of negotiated line items in the spend. In addition, the share of line items with a price breakdown and the coverage of spend analytics are suitable. A uniform basis is important: unit costs are only comparable if quantities, specifications and Incoterms are identical or have been adjusted.
Process and inventory metrics
Process costs are reflected in metrics such as effort per purchase order or the share of automated invoices – here invoice automation delivers measurable effects. On the inventory side, inventory coverage, inventory turnover and the inventory value of A items count. Failure and quality costs are typically represented via the complaint rate and delivery reliability. All metrics should be assigned clear responsibilities and target values.
Risks and controls in cost driver analysis
The most common mistakes are data gaps, a focus that is too narrow on unit prices, and measures without follow-up. Controls and clear governance prevent the analysis from becoming a one-off exercise.
Data quality and master data
A reliable analysis stands and falls with the data foundation. Missing attribute maintenance in the material master, duplicate or obsolete items and incomplete supplier assignments significantly distort the results. In practice, cleansing the material master is often the first step before the actual analysis. Consistent recording of surcharges, freight and tooling costs in the order data is also part of this.
Governance and sustainability of the measures
The results of cost driver analysis should be converted into binding targets – for example in annual price reviews, framework agreements or amended terms and conditions. Without follow-up, savings are often lost through price drift and volume changes. It is also important to examine interactions: supplier consolidation reduces costs but can increase supplier location risk. Cost savings must not come at the expense of quality, compliance or ability to deliver.
Including the supplier perspective
Cost drivers act on both sides of the business relationship. An open exchange on cost drivers at the supplier – for example energy and labour shares, capacity utilisation or purchased parts sourcing – often creates more leverage than one-sided price pressure measures. Especially with A-suppliers, a joint cost bridge with prioritisation of the measures is worthwhile. Confidentiality arrangements and a fair cost allocation are prerequisites.
Current developments and digitalisation
Digitalisation is fundamentally changing cost driver analysis: data is available faster and at a more granular level, and AI-supported evaluations accelerate pattern recognition. At the same time, risk and sustainability costs are gaining in importance.
Data automation and AI
Automated spend analytics, classified commodity group data and AI support in classification significantly shorten the analytical effort. Automatic account assignment and invoice automation provide reliable actual costs in almost real time. As a result, the analysis becomes less of an annual project and more of a continuous process. Clean master data and clear category logic remain prerequisites.
Risk and sustainability costs
Supply risks, energy volatility and sustainability requirements are increasingly being quantified as cost drivers. Ratings such as the EcoVadis rating or supplier location risk assessments feed into TCO considerations. Hedging of currency and commodity risks as well as multi-sourcing strategies are also responses to new drivers. Those who fail to evaluate these factors systematically underestimate the overall cost picture.
Typical metrics
| Metric | Benchmark | Context |
|---|---|---|
| Material cost ratio | typically 50–70% | Share of material costs in revenue; benchmark varies by industry |
| Share of analysed spend | > 80% | Share of procurement volume with an analysed cost structure |
| Inventory turnover | frequently 4–12 per year | Indicator of capital-binding cost drivers in procurement logistics |
| Complaint rate | < 1–2% | Measure of quality costs as a cost driver |
Typical practical benchmarks – they vary by industry, part and contract.
Practical example
A mid-sized mechanical engineering company carried out a cost driver analysis for its purchased parts in the mechanics commodity group. The spend analytics showed that around 80 per cent of the volume was accounted for by a small number of part families. The price breakdown using a price schedule revealed high freight and minimum batch surcharges at several A-suppliers; at the same time, inventory metrics showed above-average stock levels for B items.
- Consolidation of small suppliers and bundling of the volume with two A-suppliers
- Adjustment of batch sizes along the economic order quantity (EOQ) and improved call-off scheduling
- Joint cost bridge with the main supplier to reduce set-up and material surcharges
- Anchoring the results in the procurement manual and in the annual price review dates
Conclusion
Cost driver analysis is more than a reporting tool: it makes the causes behind material, process and logistics costs transparent and thereby creates the basis for effective negotiations and structural optimisation. Its success depends less on the methodology than on data quality, discipline in follow-up and the willingness to question specifications and processes as well. Combined with TCO thinking, supplier evaluation and continuous procurement controlling, it becomes a permanent instrument. Anyone who carries it out systematically once a year detects price drift and new drivers early. In this way, it contributes directly to planning certainty and competitiveness.
Frequently asked questions
What is a cost driver analysis?
A cost driver analysis systematically examines which factors cause costs in procurement, production and logistics. It identifies causes such as material content, batch sizes, specifications or process effort. The aim is to derive measures for sustained cost reduction rather than merely comparing prices.
Which cost drivers exist in procurement?
Typical cost drivers are material usage, scope of specifications, batch sizes and ordering rhythm, transport and warehousing costs, quality costs, and process effort within procurement itself. Price drift, energy surcharges and supply chain risks also act as drivers. Which of these dominate depends heavily on the commodity group and supplier structure.
How do you carry out a cost driver analysis step by step?
First, a sound data foundation is established using spend analytics and master data. This is followed by ABC/XYZ analysis for prioritisation, price breakdown or should-costing for the relevant items, and the derivation of concrete measures. Finally, targets are defined and implementation is tracked in procurement controlling.
What is the difference between cost driver analysis and should-costing?
Cost driver analysis is the overarching approach for identifying all cost-determining factors. Should-costing is a specific method within this analysis, in which a target cost model is built for a part or a service. The two complement each other: the analysis finds the drivers, and the should-costing evaluates them in a structured way.
Why is cost driver analysis important in procurement?
It transforms savings targets from pure price negotiations into structural optimisation at the root causes. Buyers can argue from a sound basis, set priorities and derive negotiation targets from data. In addition, it uncovers hidden costs in logistics, quality and process management that remain invisible in the unit price.
How often should a cost driver analysis be carried out?
In practice, an annual cycle per relevant commodity group has become established, supplemented by triggers such as price changes, supplier changes or new projects. With volatile commodity or energy markets, shorter cycles are sensible. What matters is less the frequency than the consistent follow-up of the measures derived.